Strategic Equity Research Report: Amazon.com Inc. (AMZN)
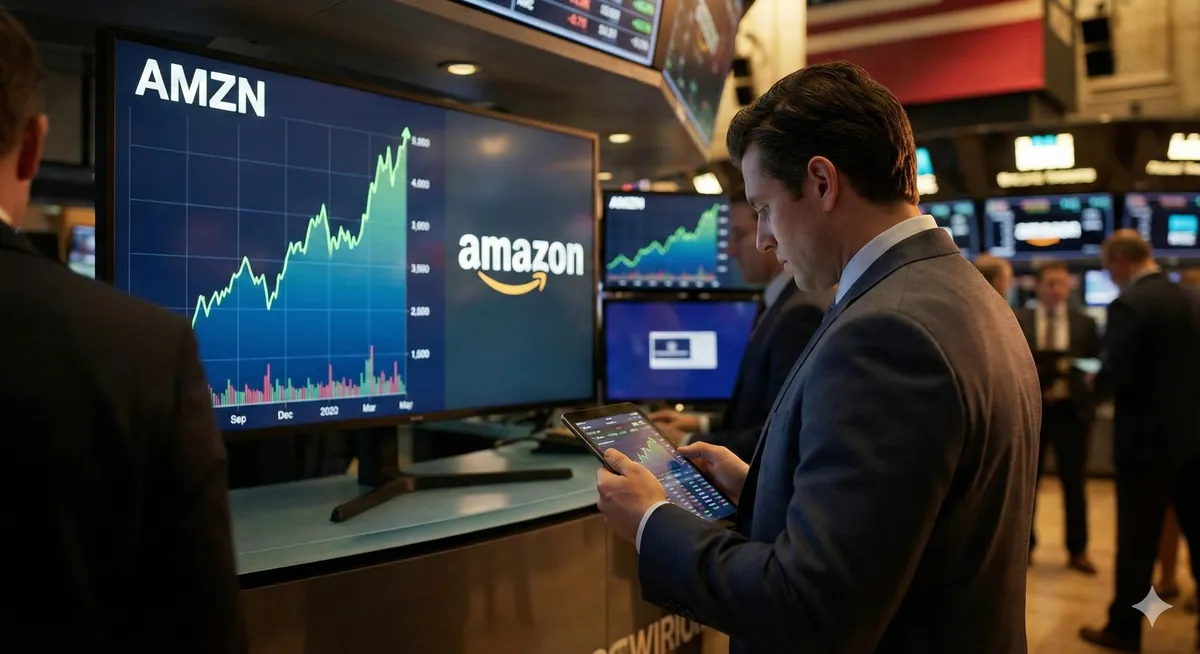
AMZN Technical Chart
Amazon.com Inc. (AMZN): Strategic Equity Research Report
Report Date: February 2, 2026
Ticker: AMZN (NASDAQ)
Reference Price: $239.30
Market Cap: $2.56 Trillion
Q4 2025 Earnings Date: February 5, 2026 (After Market Close)
1. Executive Strategic Summary: The Pivot to AI Infrastructure and Operational Efficiency
1.1 Core Investment Thesis
As of February 2, 2026, Amazon.com Inc. stands at a crucial inflection point in its corporate history. The company is emerging from a two-year period (2023-2024) characterized by rigorous cost optimization and logistics network regionalization, entering what can be defined as a "capital investment super-cycle" (Capex) driven by Generative Artificial Intelligence. The stock market, pricing the stock at around $239 per share, is discounting an economic "soft landing" scenario and betting on management's ability to monetize unprecedented infrastructure investment.
The bullish thesis for Amazon in early 2026 rests on three fundamental pillars that interact synergistically to expand the enterprise's intrinsic value:
- Structural Re-acceleration of AWS: After a period of cyclical slowdown due to cloud spending optimization by large enterprises, Amazon Web Services (AWS) has shown a vigorous recovery, with revenue growth returning above the 20% year-over-year threshold in Q3 2025. This renewed momentum is fueled by insatiable demand for compute capacity for Generative AI model training and inference, evidenced by an order backlog that has crossed the psychological and financial threshold of $200 billion.
- Margin Expansion in North American Retail: The restructuring of the US logistics network into eight distinct regional nodes has permanently altered the unit economics of shipped packages. By reducing average travel distances and increasing delivery density, Amazon has slashed the "cost-to-serve," allowing North America segment operating margins to approach 7% (excluding extraordinary charges), with a clear path to further expansion thanks to the massive integration of humanoid robotics and inventory placement algorithms.
- Advertising as a High-Margin Profit Engine: The advertising segment, with an annual run-rate now exceeding $70 billion, continues to grow at a faster pace than the core retail business (+24% year-over-year), providing the high-margin subsidies needed to fund AI infrastructure expansion without obliterating consolidated earnings. The expansion of ad inventory on Prime Video and the use of DSPs (Demand Side Platforms) to monetize off-platform traffic are critical drivers of this growth.
However, this positive thesis is counterbalanced by significant risks requiring careful monitoring. Free Cash Flow (FCF), historically Amazon investors' preferred metric, has suffered dramatic deterioration, collapsing 69% year-over-year in Q3 2025 to just $14.8 billion (TTM), crushed by a $50.9 billion surge in capital expenditures. Additionally, the impending antitrust trial with the Federal Trade Commission (FTC), scheduled for late 2026, represents a legal Sword of Damocles that could generate volatility regardless of operational fundamentals.
1.2 The 2026 Macroeconomic and Competitive Context
The 2026 operating environment is characterized by a "bifurcated consumer." While aggregate spending remains resilient, there is clear "trade-down" behavior (shifting to cheaper options) in discretionary categories. This phenomenon benefits Amazon's value proposition over traditional retailers but simultaneously exposes its flank to aggressive competition from ultra-low-cost cross-border platforms like Temu and Shein, which have eroded market share in apparel and low-cost merchandise.
In the "cloud war," Amazon maintains its leadership with an estimated global market share of around 29% in Q3 2025, although Microsoft Azure (20%) and Google Cloud (13%) remain fierce and well-capitalized competitors. The narrative prevalent in 2023-2024, that Amazon was "late" to the Generative AI party, has largely dissipated following the launch of proprietary Nova models in late 2025 and the deep integration of Anthropic's Claude models into Amazon Bedrock. The market now perceives Amazon not just as a model provider, but as the "utility company" of the AI era: the entity selling picks and shovels (chips, storage, compute) rather than just panning for gold.
1.3 Key Catalysts for 2026
Investor attention is now focused on three critical events:
- Q4 2025 Earnings (February 5, 2026): The market expects revenues of $211.3 billion and EPS of approximately $1.97. The most critical element will not be past results, but guidance on 2026 Capex. If management confirms or exceeds estimates of $150 billion in investments, market reaction will depend on clarity regarding the return on investment (ROI) timeline.
- Project Kuiper Launches: With the FCC deadline looming and extension requests already filed, 2026 is the year of truth for Amazon's satellite internet initiative. The ability to launch satellites at industrial scale will determine if this project becomes a new revenue pillar or a costly failure.
- Antitrust Developments: The FTC trial set for late 2026 will likely dominate headlines in the second half of the year, potentially creating entry or exit points based on regulatory risk perception.
2. In-Depth Financial Analysis and Multiple Valuation
2.1 Analysis of Current and Historical Valuation Multiples
As of February 2, 2026, Amazon shares trade at a forward price-to-earnings (P/E) multiple of approximately 33.8x. While this value may appear high relative to the S&P 500 average, it actually represents significant compression compared to the company's 5 and 10-year historical averages, periods when the stock frequently traded at multiples exceeding 50x-80x. This multiple contraction reflects the maturation of the retail business and the transition towards a more stable cash generation phase, albeit temporarily improved by the investment cycle.
However, P/E is often an imperfect metric for Amazon due to massive depreciation charges masking real cash generation capacity. The most relevant metric for institutional investors remains EV/EBITDA (Enterprise Value to Earnings Before Interest, Taxes, Depreciation, and Amortization).
Table 1: Valuation Multiple Comparison (Data as of Feb 2, 2026)
| Metric | Current Value (Feb 2026) | 3-Year Average | 5-Year Average | Deviation from 3Y Avg |
|---|---|---|---|---|
| P/E Ratio (TTM) | 33.8x | ~55x | ~70x | -38% |
| EV / EBITDA (LTM) | ~18.2x | 18.6x | 19.7x | -2% |
| Forward EV / EBITDA (2026E) | ~11.8x | N/A | N/A | N/A |
| Price / Sales (P/S) | ~3.7x | 3.2x | 3.9x | +15% |
| EV / Revenue | 3.7x | 3.1x | 3.8x | +19% |
Source: Elaboration on market data and consensus estimates.
Analysis indicates that the current EV/EBITDA of 18.2x is substantially aligned with the 3-year average of 18.6x, suggesting the stock is fairly valued relative to its recent history. However, the most illuminating data point is the drastic drop in forward EV/EBITDA: 11.8x based on 2026 estimates and 9.6x on 2027 estimates. This implies the market is discounting significant EBITDA expansion, driven by operating leverage in AWS and the advertising segment. If Amazon were to miss these EBITDA growth expectations, the stock would suddenly appear expensive.
2.2 "Sum-of-the-Parts" (SOTP) Analysis
To understand Amazon's true intrinsic value, it is essential to deconstruct the conglomerate into its constituent parts, as consolidated statements often obscure individual segment profitability.
-
Amazon Web Services (AWS)
- Revenue Run-Rate: ~$132 Billion (based on annualized Q3 2025).
- Growth Rate: 20%+.
- Margin Profile: ~35% Operating Margin.
- Valuation: Applying a conservative multiple of 8x sales yields an implied valuation of $1.05 Trillion.
-
Advertising
- Revenue Run-Rate: ~$70 Billion.
- Growth Rate: 24%+.
- Margin Profile: Estimated over 50%.
- Valuation: Applying a multiple of 7x sales yields a valuation of $490 Billion.
-
Core Retail (North America + International)
- Revenue Run-Rate: ~$500 Billion.
- Growth Rate: ~10%.
- Margin Profile: Low single digit (2-4%).
- Valuation: Applying a multiple of 1.0x sales yields a valuation of $500 Billion.
-
Subscription Services (Prime)
- Conservatively included in Retail valuation.
Total Implied SOTP Value: ~$2.04 Trillion. Current Market Cap: ~$2.56 Trillion.
Strategic Implication: The current market cap of $2.56 trillion reflects a "platform premium" of approximately $500 billion. Investors are assigning value to synergies between segments (the flywheel effect), future "moonshot" bets (Kuiper, Healthcare, Robotics), and the expectation that AI will expand margins beyond historical norms. The stock is not "cheap" on a liquidation basis but is priced for perfection in AI strategy execution.
2.3 The Free Cash Flow (FCF) Dilemma
A critical anomaly in the current valuation is the deterioration of Free Cash Flow. FCF collapsed 69% year-over-year in Q3 2025 to just $14.8 billion (TTM), driven by a $50.9 billion increase in Capex. The bearish narrative suggests that if AI Capex ($150 billion in 2026) fails to produce immediate returns, Amazon would essentially be burning cash at an unsustainable rate without resorting to debt. Indeed, Amazon issued $15 billion in bonds in late 2025, signaling a need for external liquidity. The bullish view interprets this as a repeat of the 2016-2017 cycle: a massive infrastructure build phase that will generate extraordinary cash harvests in subsequent years.
3. Business Model and Economic Moat Analysis
3.1 The "Flywheel" in the AI Era
The core of Amazon's business model remains the "Flywheel" theorized by Jeff Bezos. In 2026, Artificial Intelligence has become the lubricant accelerating every part of this flywheel:
- Customer Experience: Generative AI in search (Project Rufus/Olympus) improves conversion rates.
- Cost Structure: Use of "Agentic AI" and robots in fulfillment centers reduces unit "cost-to-serve."
3.2 Moat Analysis: Durable Competitive Advantages
- The Logistics Moat (Wide and Deep): Amazon's fulfillment network represents its most formidable barrier to entry. The regionalization strategy enables same-day deliveries that no competitor can match on a national scale. The moat here is Time.
- Switching Cost Moat (AWS, Wide): AWS enjoys high switching costs. The integration of proprietary chips (Trainium/Inferentia) deepens this moat: optimizing for Trainium to save money locks you into AWS hardware.
- Network Effect Moat (Marketplace & Ads, Wide): More Prime members attract more third-party sellers (3P), driving selection and advertising revenue.
4. Financial Performance: Q3 Actuals and Q4/2026 Outlook
4.1 Q3 2025 Performance Review
Q3 2025 results presented a mixed picture:
- Revenue: $180.2 billion (+13% YoY).
- Operating Income: $17.4 billion (Flat YoY), but $21.7 billion adjusted for special charges.
- Net Income: $21.2 billion, inflated by a gain in Anthropic.
4.2 Q4 2025 Earnings Preview (Release: Feb 5, 2026)
- Revenue Consensus: ~$211.3 billion.
- EPS Consensus: ~$1.97.
- Critical Element: Management commentary on 2026 Capex. If guidance exceeds $160-170 billion, expect volatility.
5. Segment Deep Dive: Amazon Web Services (AWS) and AI Strategy
AWS is Amazon's profit engine. In 2026, it is the primary theater of the AI war.
5.1 Market Share
In Q3 2025, AWS holds 29% global market share. While down from its 32-34% peak, it is stabilizing as enterprises move from experimentation (often on Azure) to production (often on AWS).
5.2 Silicon Advantage: Trainium & Inferentia
Amazon has aggressively deployed proprietary chips. Trainium2 offers 40-50% better price/performance for training vs standard GPUs, and the $200 billion backlog suggests strong adoption.
5.3 Bedrock and the "Model Garden" Strategy
AWS uses a "Model Garden" approach via Amazon Bedrock, offering access to Claude, Llama, AI21, and its own proprietary Nova models. Rumors persist about Olympus, a 2-trillion parameter model to challenge AGI.
6. Segment Deep Dive: Retail & Commerce
6.1 North American Margins
Operating margins have recovered to nearly 7% (adjusted) thanks to logistics network regionalization reducing shipping distances.
6.2 The "Low-Cost Storefront" vs. Temu
In response to Temu, Amazon is launching a "Low-Cost Storefront" with items under $20 shipped directly from China. It is a defensive strategy to protect Prime value and prevent Temu from moving up the value chain.
7. Segment Deep Dive: Advertising
Ad revenue is growing 24% YoY, with a run-rate of $71 billion. Ad expansion on Prime Video and AI usage to generate ad creatives for SMBs are key growth drivers.
8. Strategic Growth Initiatives (Moonshots)
- Project Kuiper: The $10 billion satellite bet faces delays. 2026 is the year of truth.
- Healthcare: Restructuring to integrate One Medical and Pharmacy.
- Robotics: Deployment of humanoid robots (Digit) to handle unstructured tasks.
9. Regulatory and Risk Landscape
- FTC Antitrust Trial (Late 2026): The biggest legal threat, attacking the link between Prime and FBA.
- Digital Markets Act (DMA): Amazon designated as "Gatekeeper" in EU.
- Geopolitical Risks: Dependence on TSMC and tariffs on China.
10. Future Outlook: 2030 Scenarios
10.1 Financial Projections
Table 2: Long-Term Financial Projections
| Metric | 2025 (Est) | 2026 (Proj) | 2027 (Proj) | 2030 (Scenario) |
|---|---|---|---|---|
| Revenue | ~$714 B | ~$795 B | ~$880 B | ~$1.2 Trillion |
| Op. Income | ~$60 B | ~$75 B | ~$95 B | ~$140 B |
| Op. Margin | ~8.4% | ~9.4% | ~10.8% | ~12% |
| EPS | ~$7.14 | ~$7.86 | ~$10.50 | ~$18.00 |
Source: Consolidated analyst estimates and trend extrapolations.
10.4 Conclusion
Amazon in February 2026 is a company aggressively reinventing itself. It is trading short-term cash flow for long-term AI dominance. The valuation is demanding but supported by the strongest competitive moats in tech. For investors, the key metric to watch in 2026 is AWS revenue acceleration: if that engine works, massive Capex spend will be forgiven. If it stalls, the stock faces a painful repricing.
Share this Analysis